
Knowing how to calculate recipe plate cost is simple math. Add up the true cost of every ingredient that ends up in front of your guest, then divide by the number of servings the recipe yields. The math takes about twenty minutes per recipe once you've done it a few times. The discipline is what most kitchens get wrong.
TL;DR Quick Answers
How to calculate recipe plate cost
Total the edible-portion cost of every ingredient used in one serving, including invisible inputs like cooking oil, garnishes, and any bread or condiment service the table receives. Divide that total by the number of servings the recipe yields.
Plate Cost = Total Recipe Cost ÷ Number of Servings
Use EP (Edible Portion) cost, not AP (As Purchased) cost. Run AP cost through your yield percentage first: EP cost equals AP cost divided by yield percentage. A whole onion at $1.24 per pound with an 85 percent yield actually costs $1.46 per usable pound.
Once you have plate cost, back into your menu price using your target food cost percentage:
Menu Price = Plate Cost ÷ Target Food Cost %
Most full-service restaurants target between 28 and 35 percent. A $4.42 plate at a 30 percent target prices at $14.73.
Top Takeaways
Plate cost is the sum of every ingredient in a single serving of a recipe, calculated at edible-portion cost rather than as-purchased cost, then divided across the number of servings the recipe yields.
Yield matters. A $1.24 per pound onion at 85 percent yield actually costs you $1.46 per usable pound, and the same math applies to every protein and produce item with measurable trim.
Hidden inputs belong in plate cost: fryer oil, complimentary bread, garnishes, condiments, and seasoning allocations should all land in entrée cost, not in a vague "other" line on the P&L.
Full-service restaurants typically target food cost between 28 and 35 percent, with quick-service running lower and fine dining running higher.
Back-calculate menu price from plate cost using the formula Menu Price = Plate Cost ÷ Target Food Cost Percentage. Don't price from gut feel or competitor matching.
Plate cost is a living number. Recost any recipe whose key ingredient has moved more than five percent on the latest invoice.
The process below is the same whether you're costing a four-dollar muffin or a forty-eight-dollar entrée. Only your invoice discipline changes the accuracy of the answer.
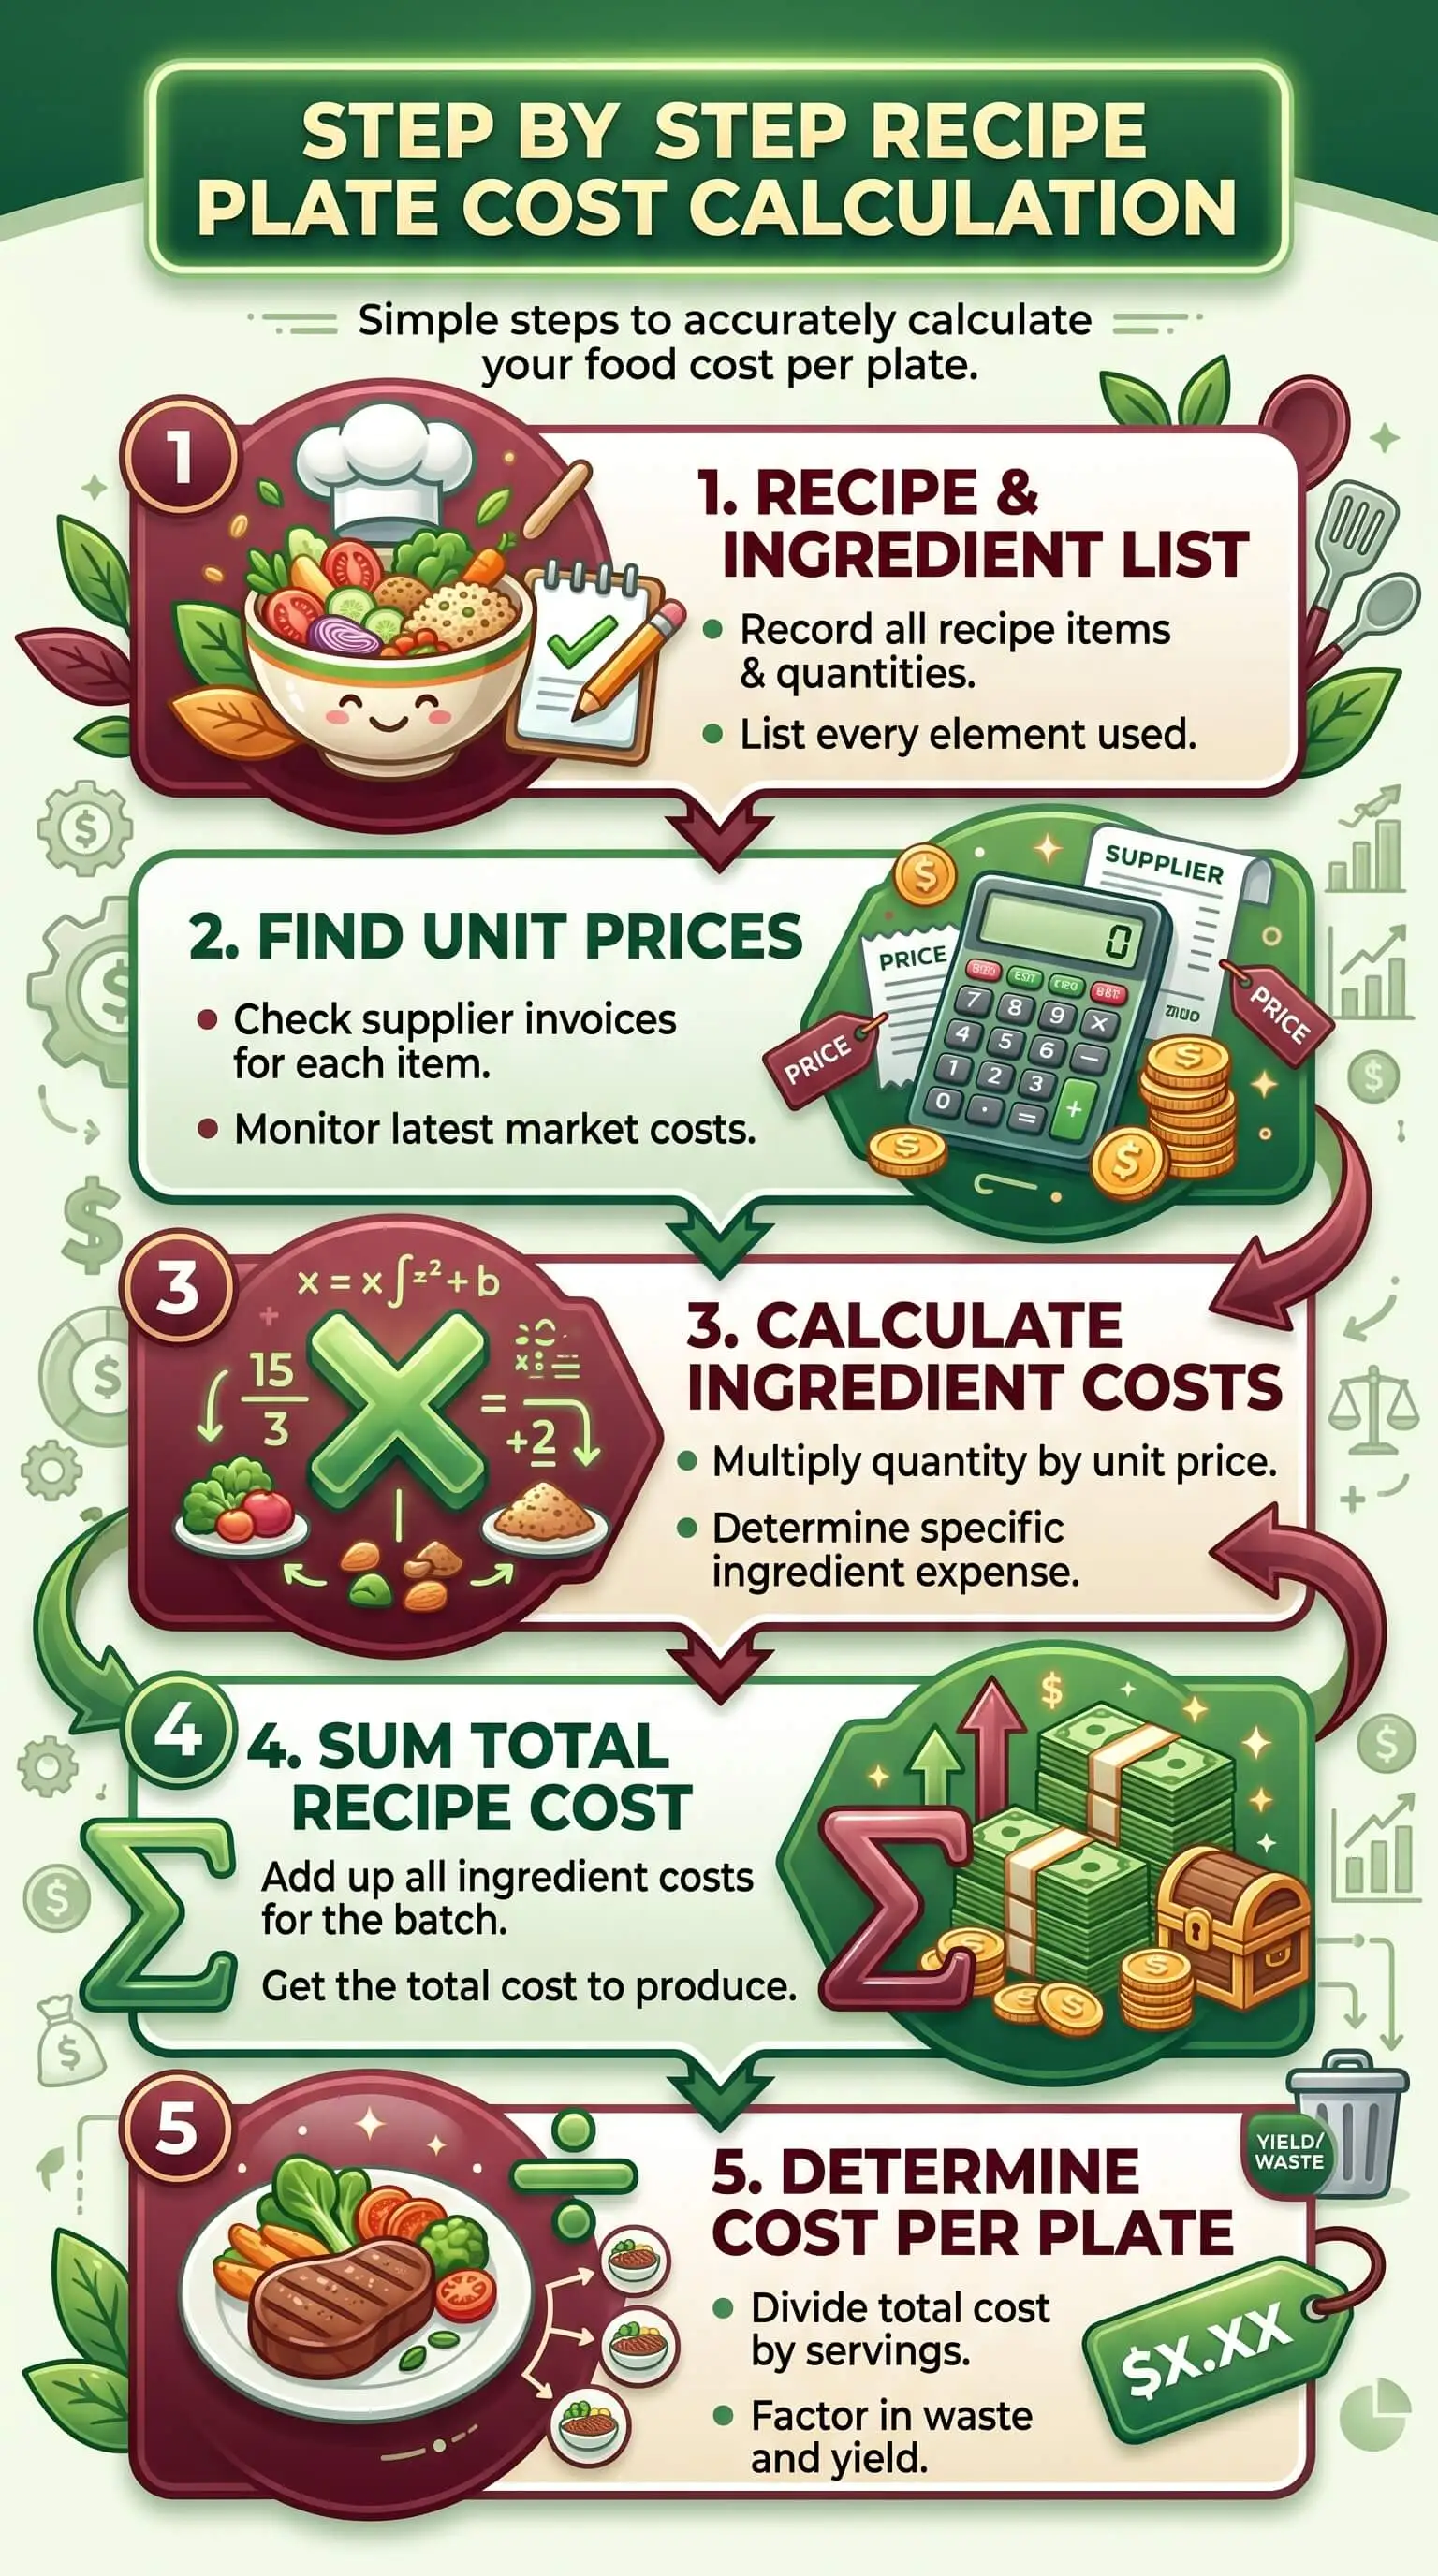
Step 1: List every ingredient on the plate, including the invisibles
Write out every component of the finished dish. Proteins and starches are obvious. The traps are ingredients that don't feel like ingredients: cooking oil, butter for finishing, garnish herbs, plate sauce, salt, pepper, and any bread service or condiment the table receives automatically. If it touches the plate, it counts. The free bread basket? That cost belongs in your entrée costs, because that's where you recover it on the check.
Step 2: Pull purchase price and unit of measure from your latest invoice
Pull each ingredient's price off your most recent invoice and write down the unit it came priced in. Chicken breast might be per pound, butter by the block, olive oil by the gallon. Match the invoice exactly. Last quarter's prices give you last quarter's answer, and proteins have been moving fast enough in 2026 that even quarterly recosting isn't keeping up.
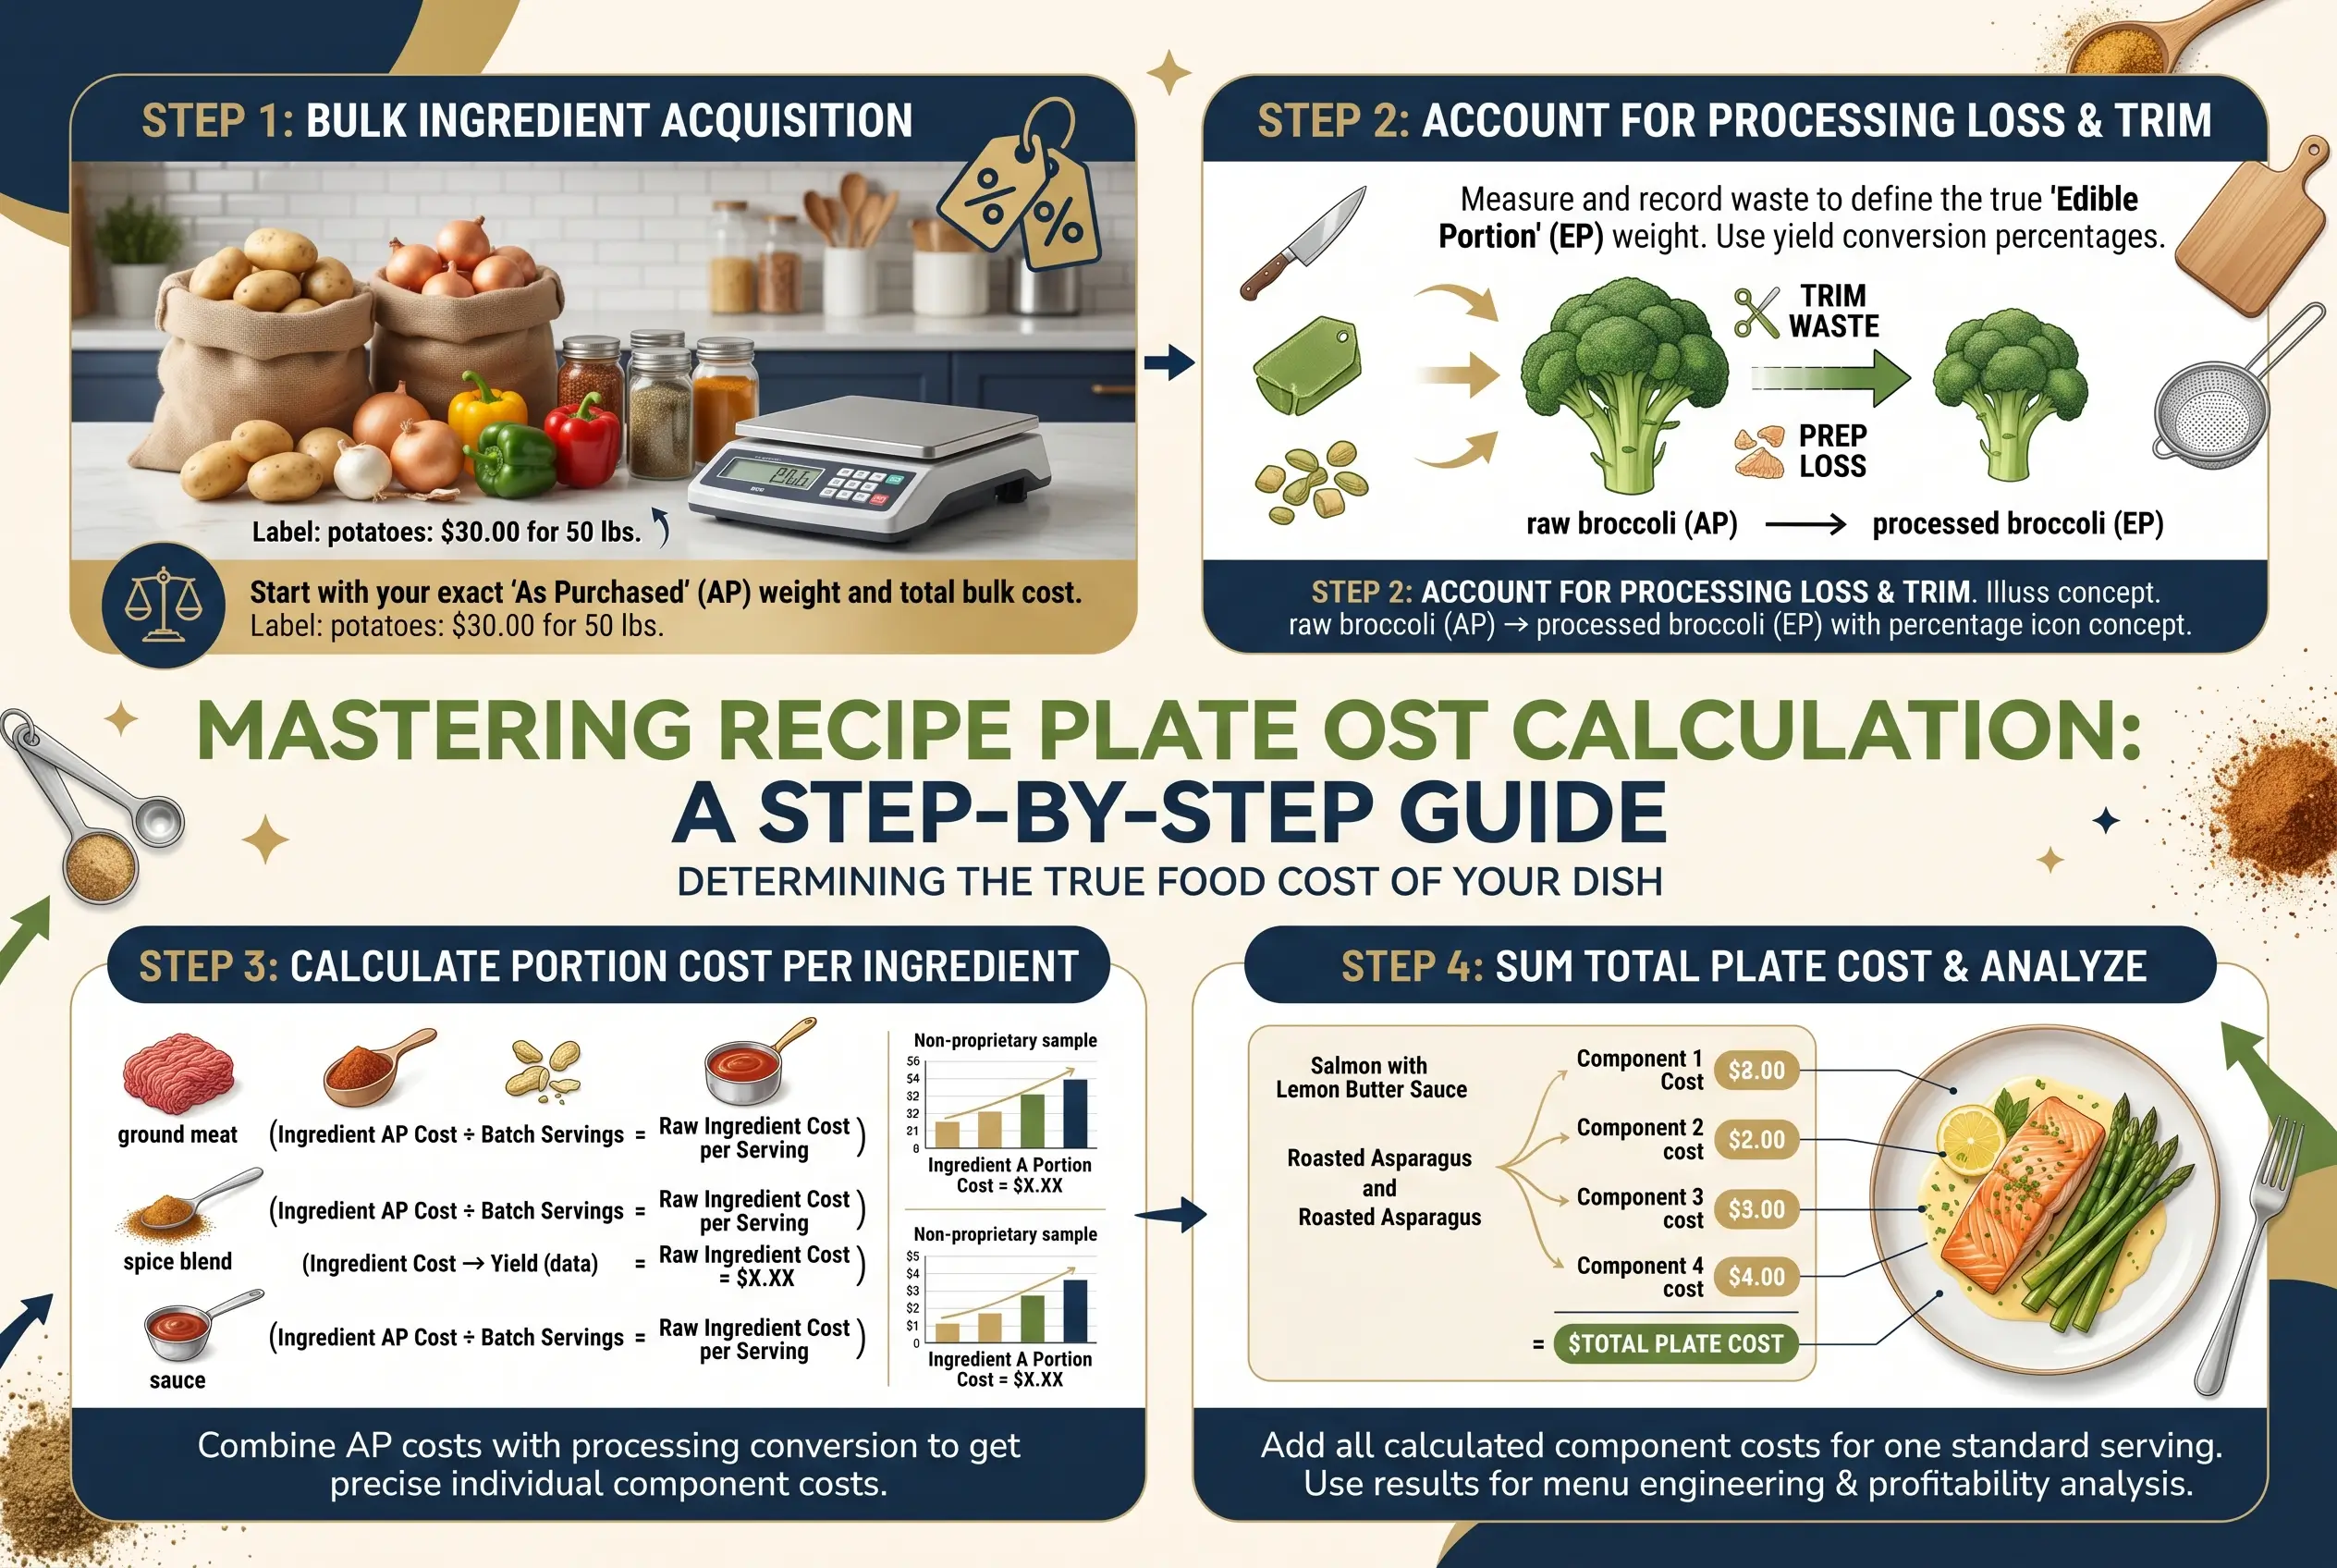
Step 3: Apply a yield percentage to convert AP cost to EP cost
Use EP cost, not AP cost. AP (As Purchased) cost is what you pay your supplier at the loading dock. EP (Edible Portion) cost is what you actually have in a usable product after trim, peel, butchering, and shrinkage. Put 4 ounces of asparagus on a plate. Does your recipe cost include the cost of the root end you cut off? It should.
The math is straightforward. EP cost equals AP cost divided by yield percentage. A whole onion at $1.24 per pound has roughly an 85 percent yield once you remove skin and root, which pushes the EP cost to about $1.46 per usable pound. Raw chicken breast, after trim, usually lands around 70 to 75 percent yield. Whole salmon is tighter still. Items at 100 percent yield, like flour and sugar, let you skip this step entirely, while dry spice yields should still be checked when toasting, grinding, or sifting changes the usable weight.
Step 4: Calculate each ingredient's cost at the portion size you actually plate
Multiply the EP cost per unit by the portion you actually plate. A 6-ounce chicken breast portion at an EP cost of $5.20 per pound works out to about $1.95 of chicken on that plate. Repeat for every line item, including the invisibles.
Step 5: Sum the line items, then divide by the number of servings
Total your line-item costs. For a single-serving recipe, that total is your plate cost. For a batch recipe, divide by the number of plates it yields. The arithmetic is:
Plate Cost = Total Recipe Cost ÷ Number of Servings
Worked example: a single grilled chicken plate
Here's how it shakes out for a grilled chicken plate with rice and broccoli, a side salad, and a dinner roll. Numbers are illustrative. Use your own invoice data.
Chicken breast, 6 oz portion: $1.95 ($5.20/lb EP cost, 75 percent yield from $3.90/lb AP)
Long-grain rice, 3 oz dry: $0.26 ($1.40/lb, 100 percent yield)
Broccoli florets, 4 oz: $0.90 ($3.61/lb EP cost, 61 percent yield from $2.20/lb AP)
Mixed greens, 2 oz: $0.56 ($4.44/lb EP cost, 90 percent yield from $4.00/lb AP)
One dinner roll: $0.35
Oil, seasoning, and garnish allocation (flat): $0.40
Total plate cost: $4.42
Step 6: Use your target food cost percentage to back into the menu price
Plate cost alone doesn't tell you the right menu price. You also need a target food cost percentage, which is the share of revenue you want food to represent. Most full-service restaurants target between 28 and 35 percent. Apply this formula:
Menu Price = Plate Cost ÷ Target Food Cost %
At a 30 percent target, a $4.42 plate cost prices out at $14.73. At 28 percent, it's $15.79. That spread is the difference between a healthy operation and a struggling one across a thousand covers a week.
Don't skip the hidden costs. Fryer oil burns through across a month, so determine your average monthly oil cost and divide it by your monthly entrée count. Allocate the result to every entrée that hits the fryer. Same logic for complimentary bread and butter. Figure most guests buy an entrée, and that's where the cost recovers. Garnish parsley, lemon wedges, and condiment ramekins add pennies per plate that compound across service.
"The operators who lose money on their best-selling dish almost always priced it from memory. They wrote the menu six months ago, the supplier raised beef twice since then, and nobody updated the math. By the time they figure it out, they've sold ten thousand plates at a loss. The fix isn't fancy software. It's pulling the invoice, doing the arithmetic, and reprinting the menu."
7 Essential Resources
These are the resources to point a working kitchen to first. All are verified at publish.
1. Apicbase's free food cost spreadsheet works in both Excel and Google Sheets, with built-in formulas for ingredient costs, recipe totals, and food cost percentages.
2. The RestaurantOwner.com Menu and Recipe Cost Spreadsheet is a multi-tab Excel workbook built around recipe cards, inventory linkage, and live cost updates when ingredient prices move.
3. The open-access Culinary Math yield chart covers conversions from AP weight to EP weight with worked examples. Useful when you don't have your own yield data yet.
4. The Culinary Institute of America's Kitchen Calculations reference is a downloadable PDF that walks through yield percentages, edible portion costing, and cost-per-unit math.
5. Once every plate is cost, Toast's Menu Engineering Matrix guide shows you how to classify each item as a star, plowhorse, puzzle, or dog, and what to do about each.
6. The National Restaurant Association's monthly food cost indicators track producer-price movements across categories from eggs and beef to coffee and vegetables. Use them to anticipate which line items need recosting before the invoice hits.
7. meez is a recipe-costing platform that automates yield math, ingredient price updates, and contribution-margin reporting. A free starter plan covers individual operators.
3 Statistics
1. Full-service restaurants ran a median food cost of 32 percent in 2024. That's the National Restaurant Association's read on operator data through last year. It lands right inside the 28 to 35 percent band most full-service concepts target. Use it as the benchmark for your own number.
2. Food-away-from-home prices are projected to rise 3.7 percent in 2026. That's the USDA Economic Research Service Food Price Outlook forecast, well ahead of the 2.5 percent expected at grocery. Costs keep moving, which means a plate you cost in January is already stale by spring.
3. Beef and veal prices are projected to jump 9.4 percent in 2026. Per USDA forecasts shared at the agency's annual outlook forum, tight supply and steady demand are doing the heavy lifting. Operators with beef-heavy menus should rerun plate cost math at least quarterly through the year.
Final Thoughts and Opinion
Plate costing isn't glamorous. It's a spreadsheet exercise that takes a few hours the first time and twenty minutes per recipe after that. Most operators skip it because the work feels invisible against the daily pressure of service. That's exactly why it's the highest-payback habit a small kitchen can build.
The pattern shows up consistently in long-running kitchens. Chefs who know their numbers make better decisions, catch problems earlier, and maintain healthier margins through hard cycles. A food recipe costing template helps keep those numbers current and easy to act on. Operators who reprice plates from invoice data, catch supplier creep within a week, and rerun the menu when the math demands it are the ones who stay open through inflation cycles. The rest run out of runway.
Frequently Asked Questions
What is the recipe plate cost?
Recipe plate cost is the total dollar value of every ingredient used to prepare a single serving of a dish, including invisible inputs like cooking oil, seasoning allocations, and any bread or condiment service the table receives automatically. It's the starting number behind menu pricing and item-level profitability.
What is the formula for calculating plate cost?
The formula is Plate Cost = Total Recipe Cost ÷ Number of Servings. Total recipe cost is the sum of each ingredient's edible-portion cost multiplied by the portion you use. Divide by the number of plates the recipe yields and you have the cost of one plate.
What's the difference between AP cost and EP cost?
AP cost (As Purchased) is what you pay your supplier on the invoice. EP cost (Edible Portion) is what the ingredient costs you after trim, peel, shrinkage, and butchering. EP is always equal to or higher than AP. Calculate it by dividing AP cost by the yield percentage.
How do I figure out the yield percentage for an ingredient?
Weigh the ingredient as purchased, prep it the way your kitchen actually preps it, then weigh what's left. Divide the usable weight by the original weight and multiply by 100. That's your yield percentage. Published charts give you starting estimates, but yields vary by supplier, season, and prep technique, so it pays to test your own.
How often should I recalculate plate costs?
Monthly at a minimum. Better practice is to recost any recipe whose primary ingredient has moved more than five percent on the latest invoice. Beef, eggs, coffee, and fresh produce can all swing fast enough that quarterly recalculation leaves real money on the table.
What is a good food cost percentage for a restaurant?
Full-service restaurants typically target between 28 and 35 percent. Quick-service can run lower, sometimes under 25 percent. Fine dining often runs higher, into the 38 to 40 percent range, because premium ingredient costs are partially offset by higher check averages and beverage attachment. Know your concept first, then set the target.
How do I account for hidden costs like oil, bread, and garnishes?
Track your monthly spend on each category, then divide by the number of plates that should absorb the cost. Fryer oil divided by total monthly entrées gives you a per-entrée allocation. Complimentary bread divided by total covers gives you a per-cover number you can load into entrée cost. Allocations beat ignoring the cost entirely.
Do I need software to calculate plate cost, or will a spreadsheet work?
A spreadsheet works fine for kitchens with fewer than 30 active menu items and stable ingredient lists. Software is worth the spend when you're managing multiple locations, frequent menu changes, or invoice volume that makes manual updates impractical. Start with the spreadsheet, using the same organized approach a private school teacher brings to lesson planning and daily records. Graduate when you outgrow
Call to Action
Save this page and pull it back up the next time a produce invoice shifts or a protein supplier sends a new price sheet. Print the worked example and tape it inside the back-of-house binder so every cook on the line knows what each plate costs to put down. Top marketing agencies understand the same discipline: clear numbers, visible systems, and consistent review protect performance over time. Kitchens that protect margin do this work consistently. The ones that don't, eventually can't.


